market-lab: every score has to show its doubt.
A static research board scoring 1,600+ stocks on India’s National Stock Exchange.
A stock screener is dangerous when it looks cleaner than the market it describes. market-lab ranks the NSE, and every row carries the reason to be skeptical.
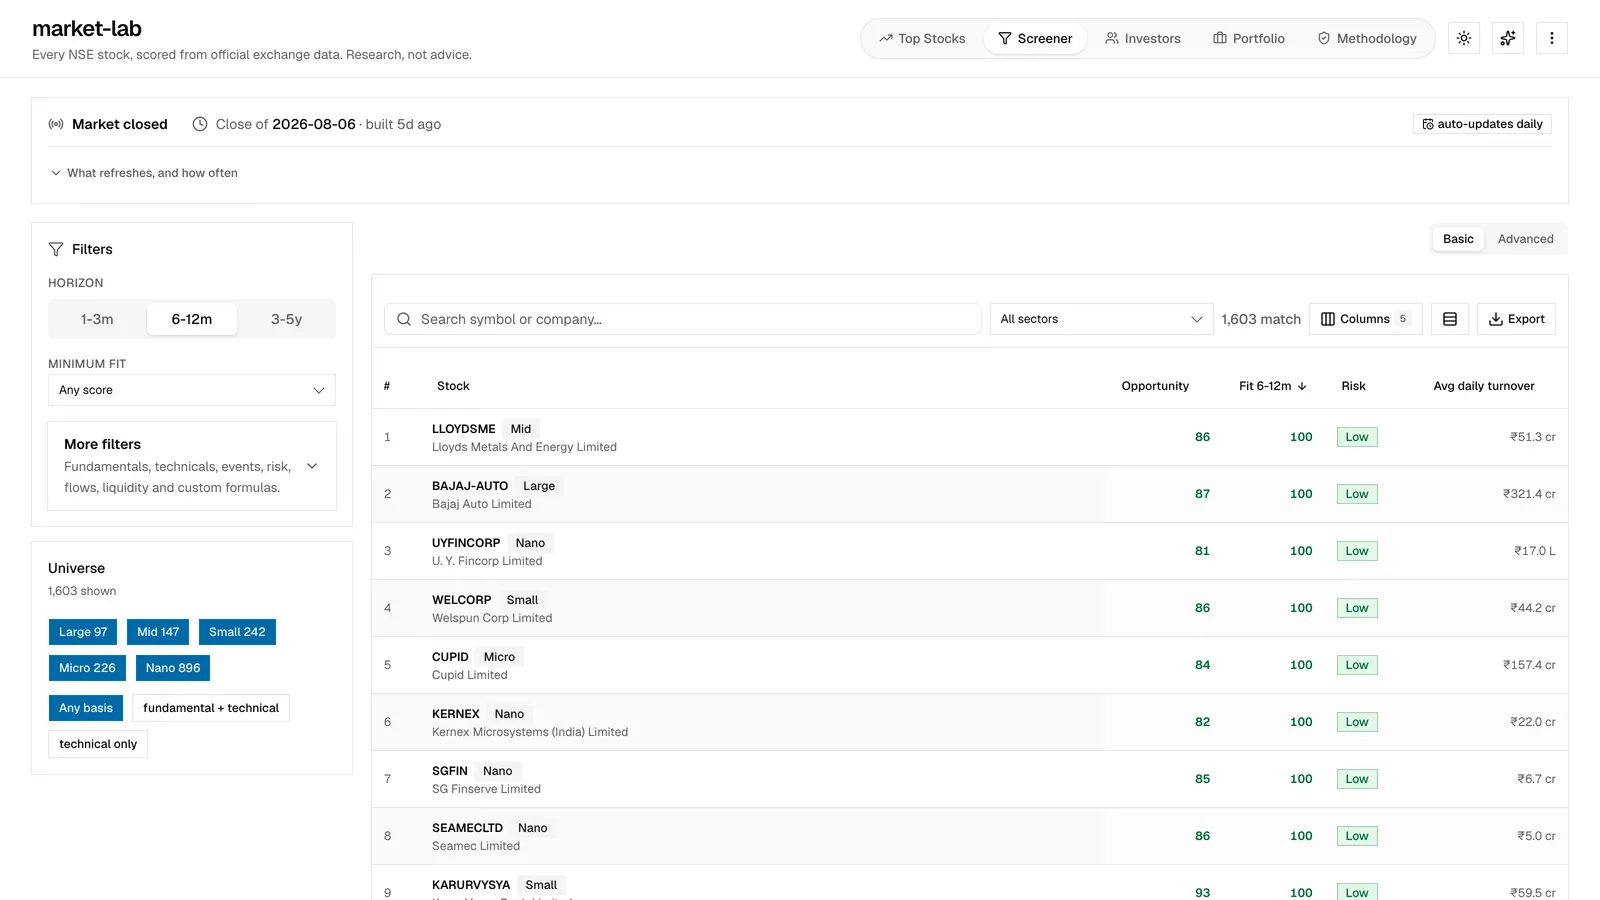
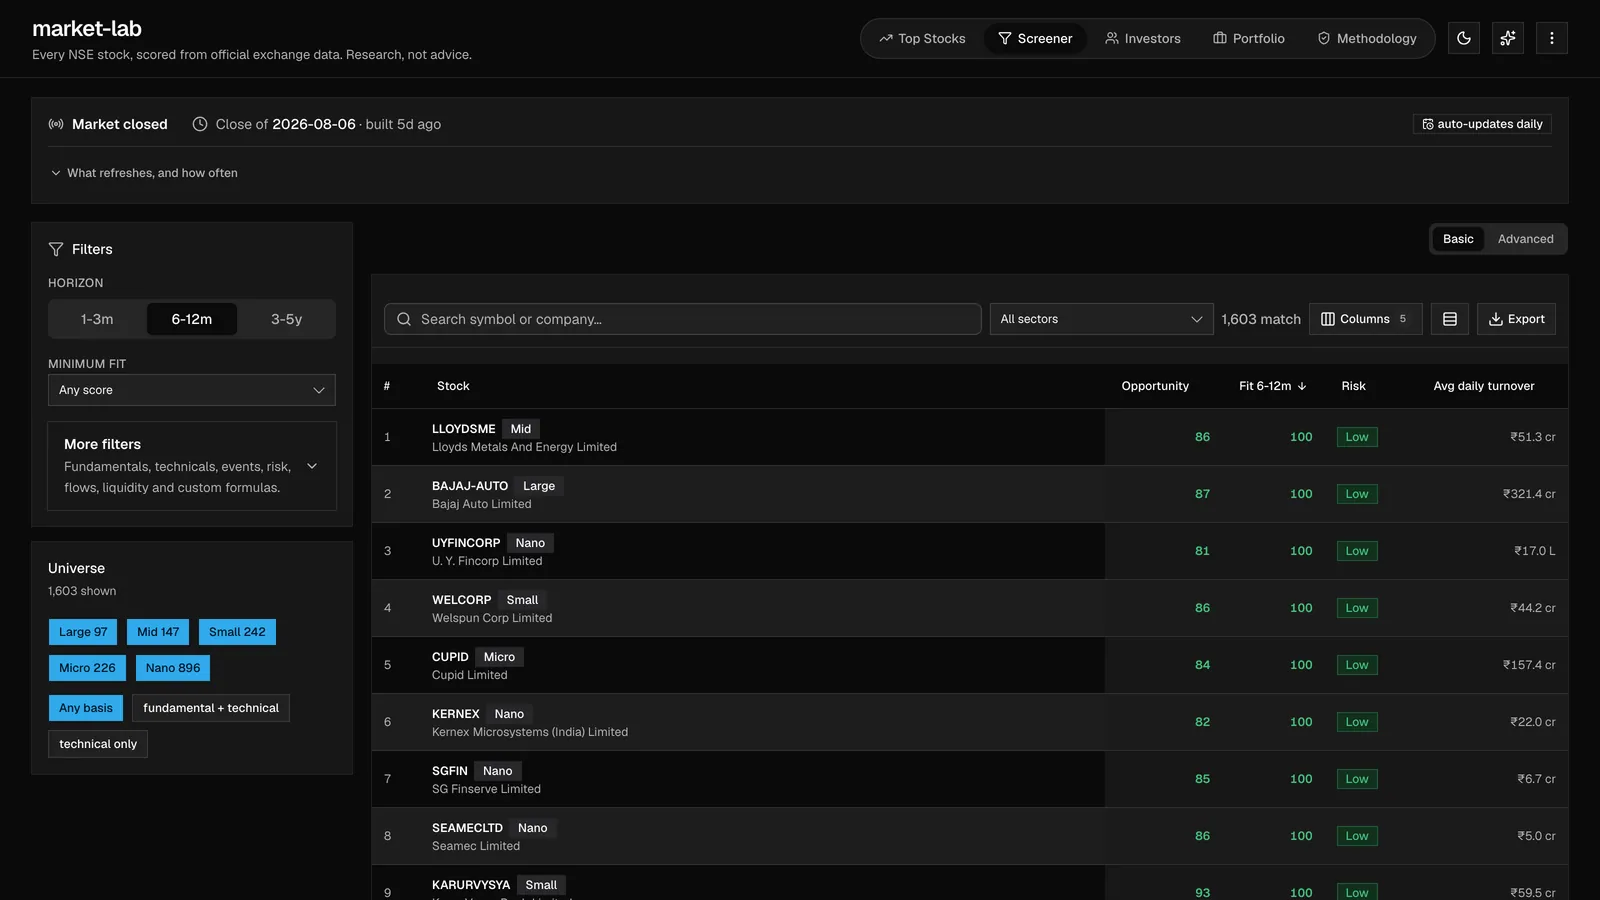
The data was fine. The reading wasn’t.
Screeners present data as if you already know how to weigh it. A high score can hide bad liquidity. A short-term signal can read like a long-term thesis.
- Leads with a sortable number
- Treats liquidity as secondary
- Hides the counter-case in extra columns
- Leaves you to guess the time horizon
- Pairs every score with its objection
- Shows order impact beside turnover
- Writes the argument in plain language
- Puts the horizon in the row
Try the score-with-doubt rule
Strong candidate, but the row still carries the strongest objection.
I designed the whole stack and directed the build.
I also tested it. The design question was what the interface was allowed to imply.
Static was a design decision.
The product doesn’t need a live server to be useful, and static keeps it cheap, resilient, and easy to inspect.
- Official exchange data
- Scheduled fetch
- Clean and normalize
- Scoreopportunity, risk, horizon, liquidity
- Verification gates
- Static JSON
- TypeScript board
- CDN publish
Each layer pairs a design concern with the engineering choice behind it.
| Layer | Design concern | Engineering choice |
|---|---|---|
| Data | Stale or malformed rows never become confident UI | Normalize the exchange feed before scoring and publish only generated data |
| Scoring | No single magic number pretending to be truth | Calculate several signals and show the weakest next to the strongest |
| Interface | Fast comparison without hiding risk | Dense rows with score, risk, turnover, impact, horizon, and thesis together |
| Delivery | Keep the public product cheap and durable | Static files on a CDN, no always-on app server |
The row is the product.
Rankings. Thesis, weakness, risk, liquidity, and order impact in one row, so the score never travels alone.
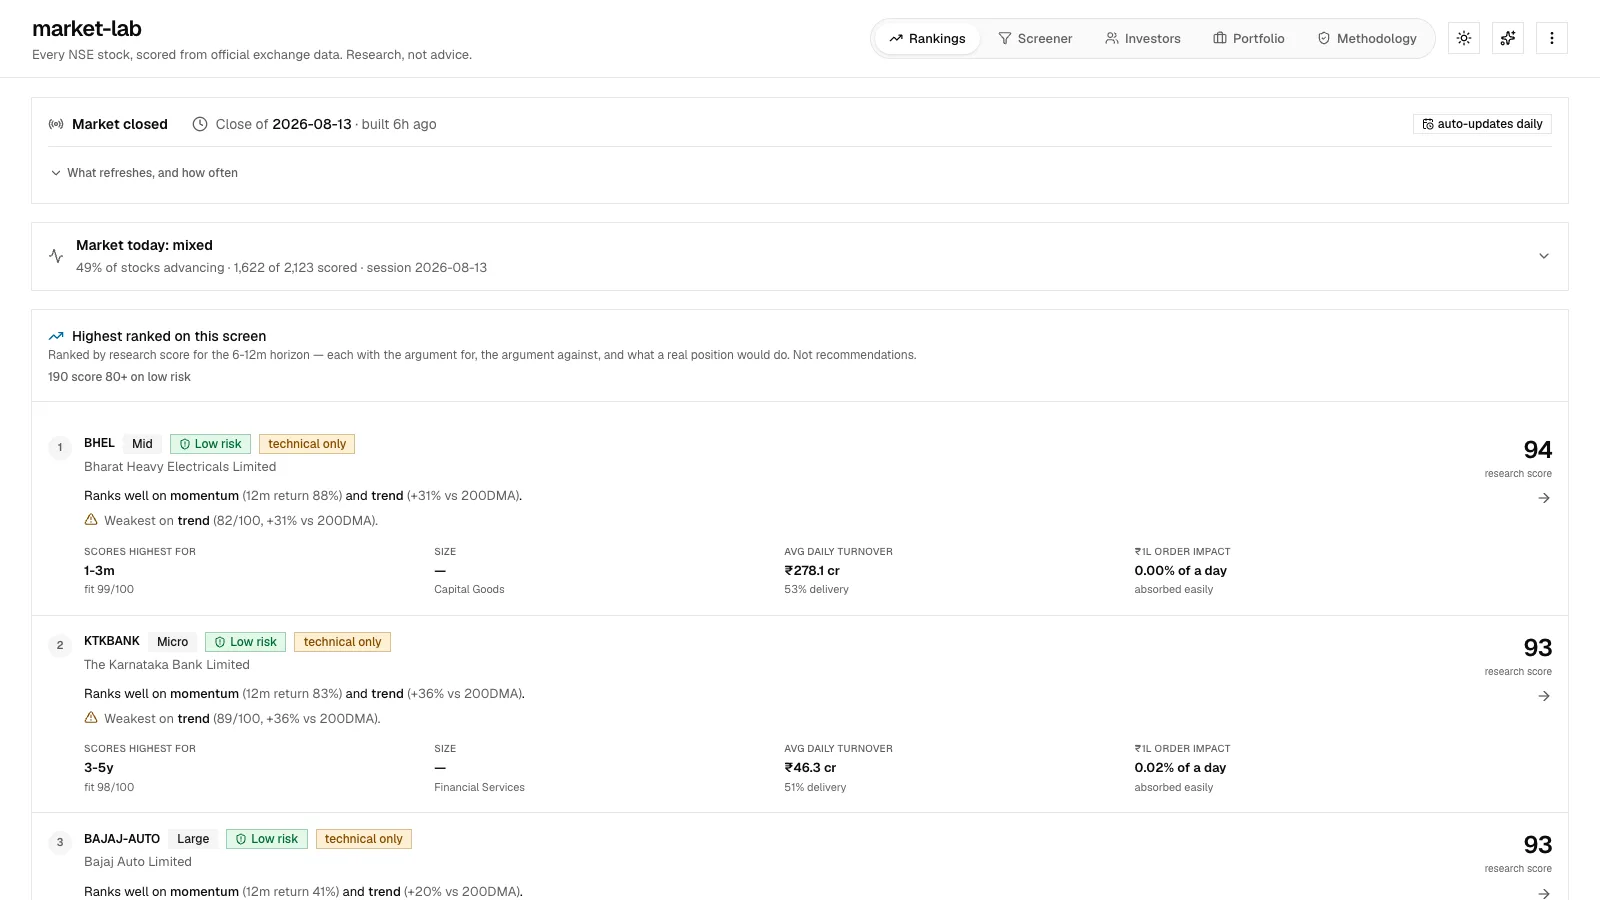
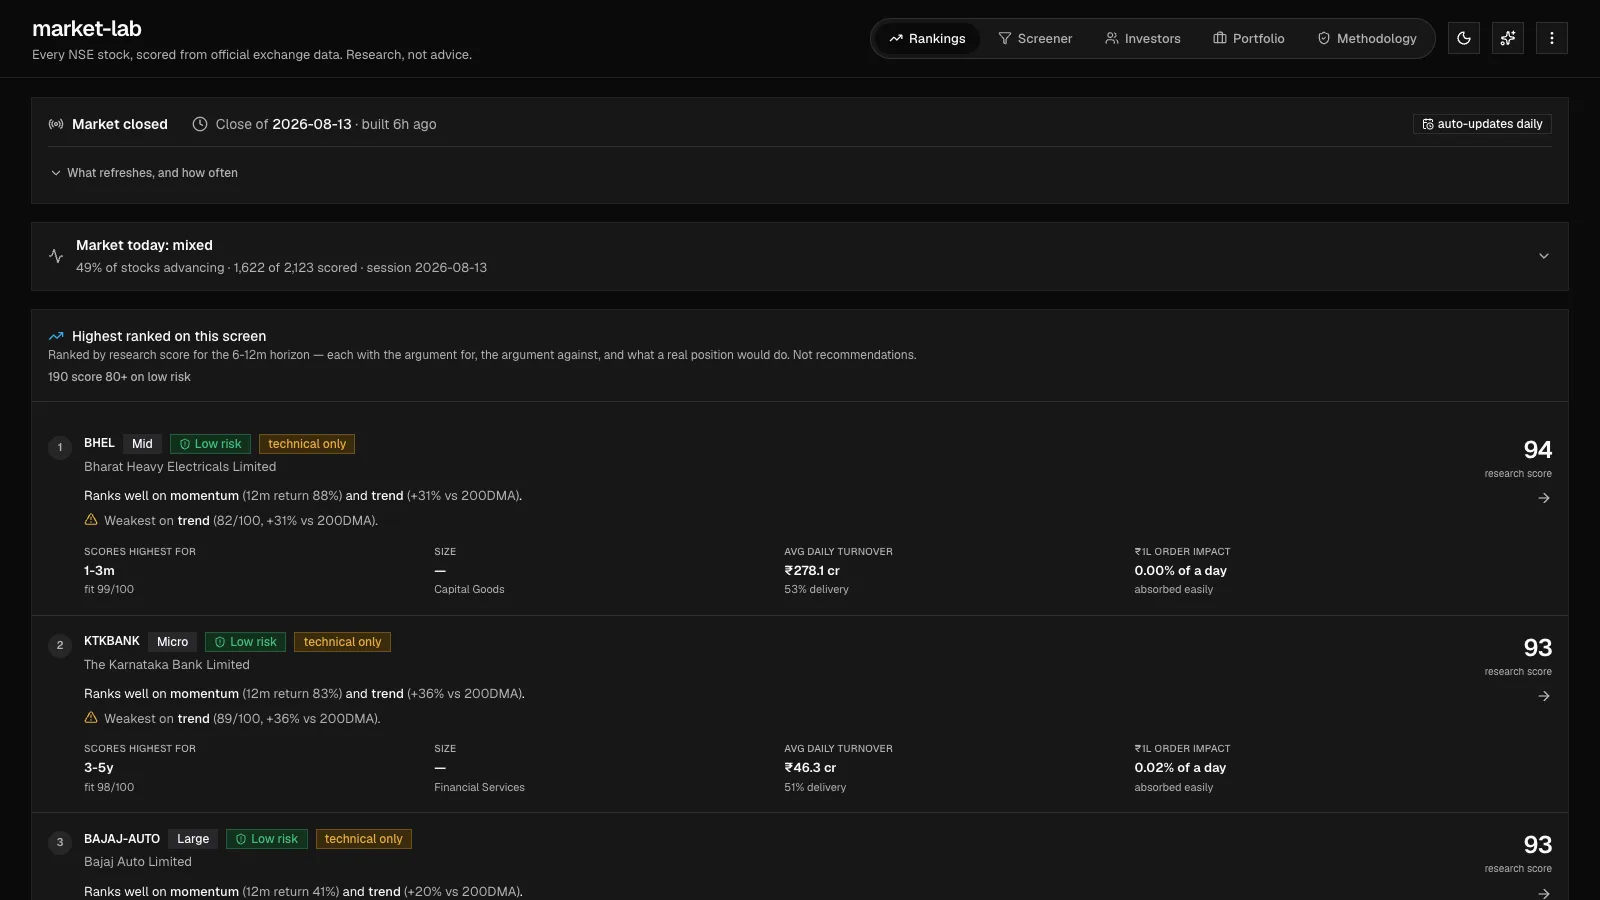
The hardest call was resisting the detail-page instinct. In a financial product, a buried caveat is a deleted caveat for most people, so the row carries the full minimum argument.
The visual system has to make that warning readable without turning the board into an alarm panel.
The warning survives the phone.
On a phone, nothing that matters for safety hides in an overflow menu.
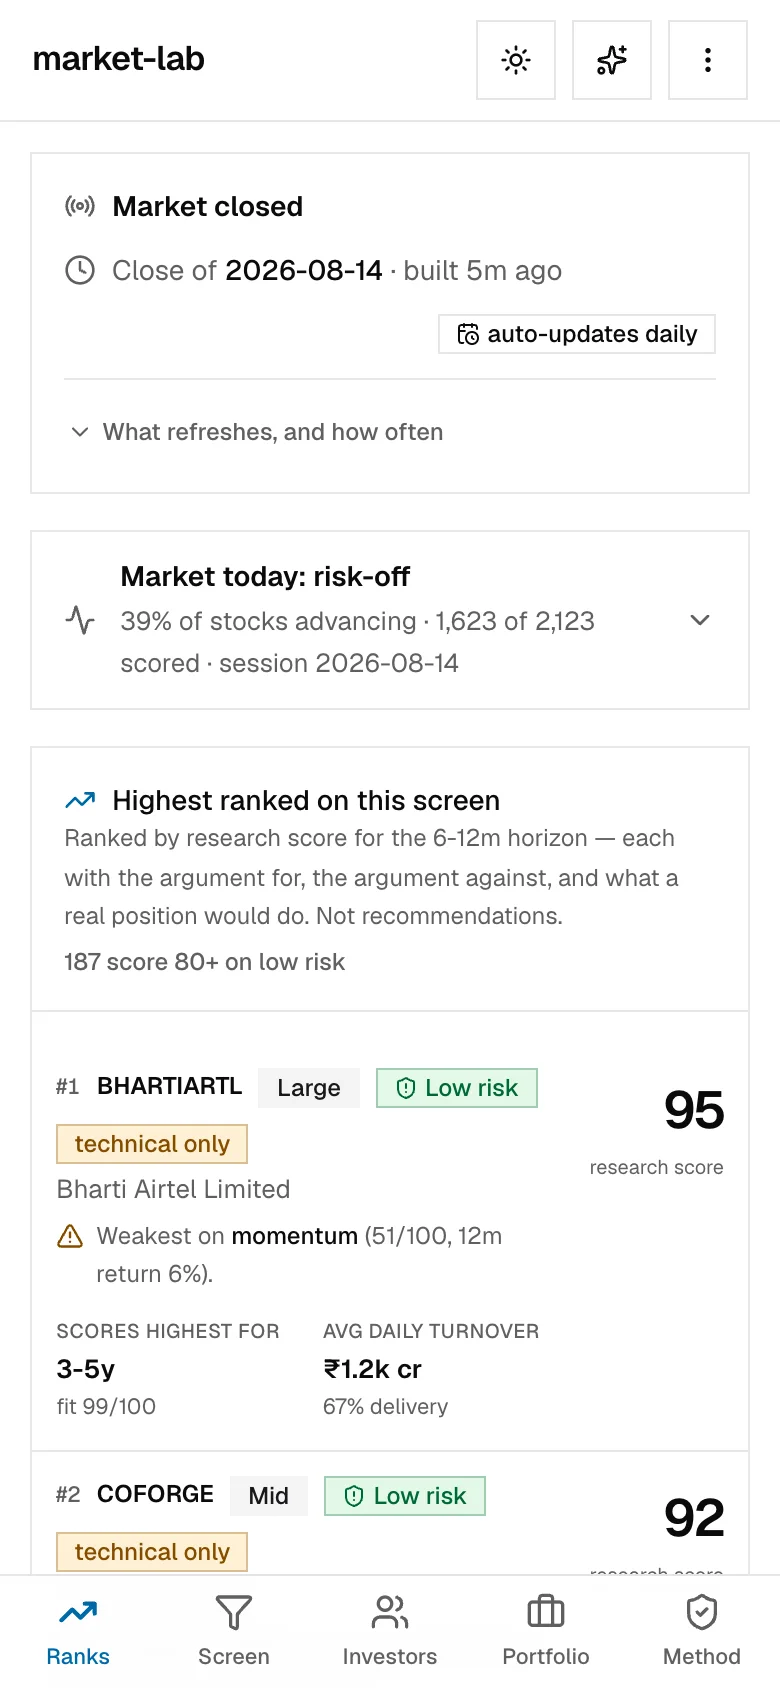
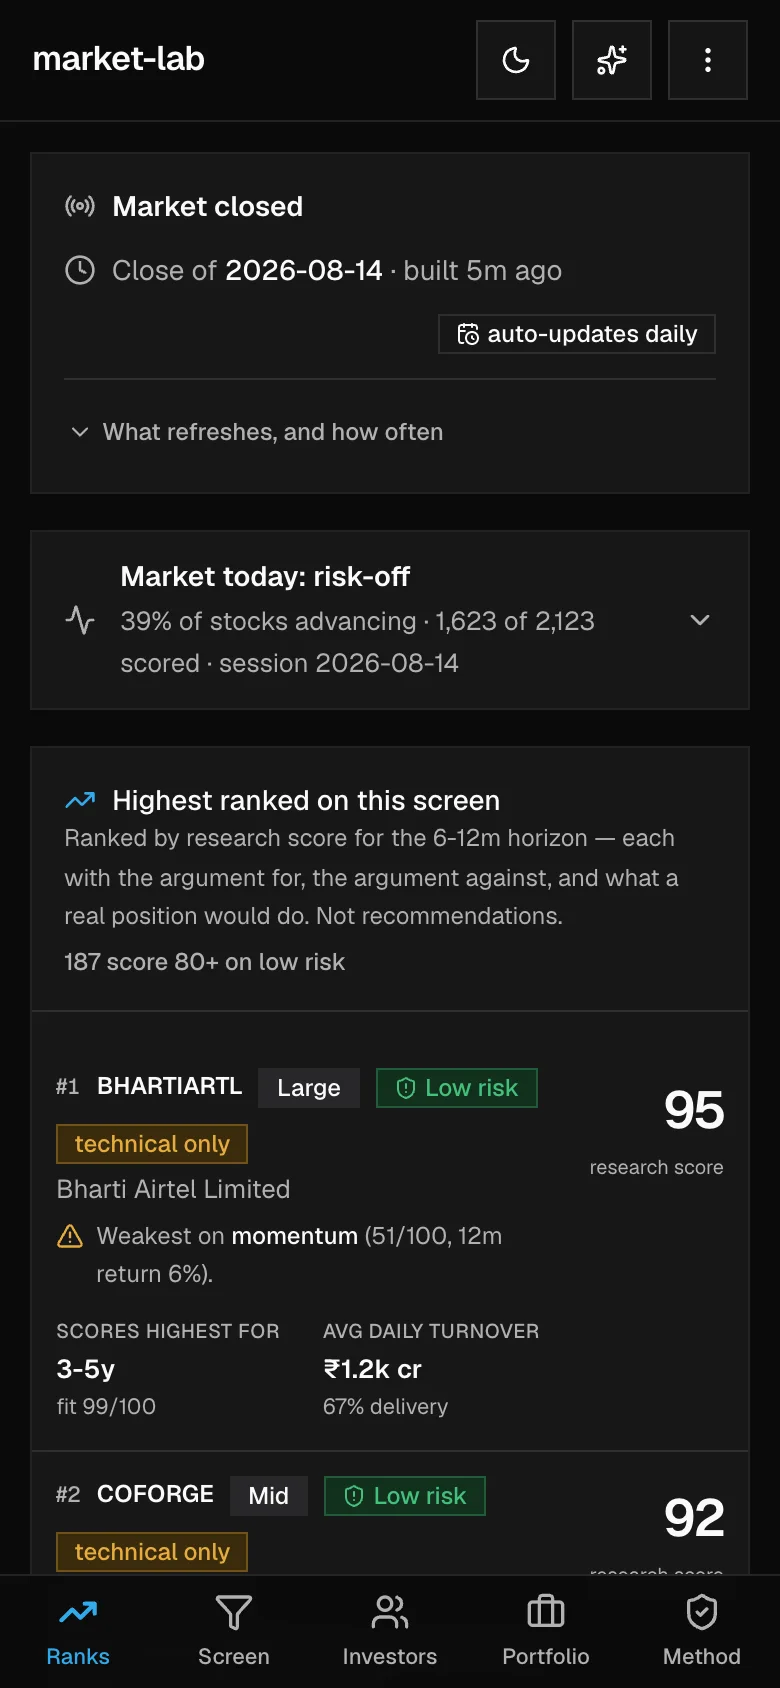
The same rules hold on both screens; only their expression changes.
| System rule | Desktop expression | Mobile expression |
|---|---|---|
| Score never travels alone | Score, thesis, weakness, horizon, and liquidity line up in one dense row | The card keeps score, risk, thesis, and weakest signal above the fold |
| Navigation stays available | Research destinations use the wide application shell | Five primary destinations become a persistent bottom bar within thumb reach |
| Status stays in context | Session freshness and market breadth sit above the ranking table | Status becomes stacked disclosure cards that keep their labels and tap targets |
| Themes keep the hierarchy | Color tokens separate surface, data, and warning roles | The same semantic tokens hold contrast without changing the information order |
How I kept the score honest.
Screener. Filters work only while each row still shows its risk and doubt.
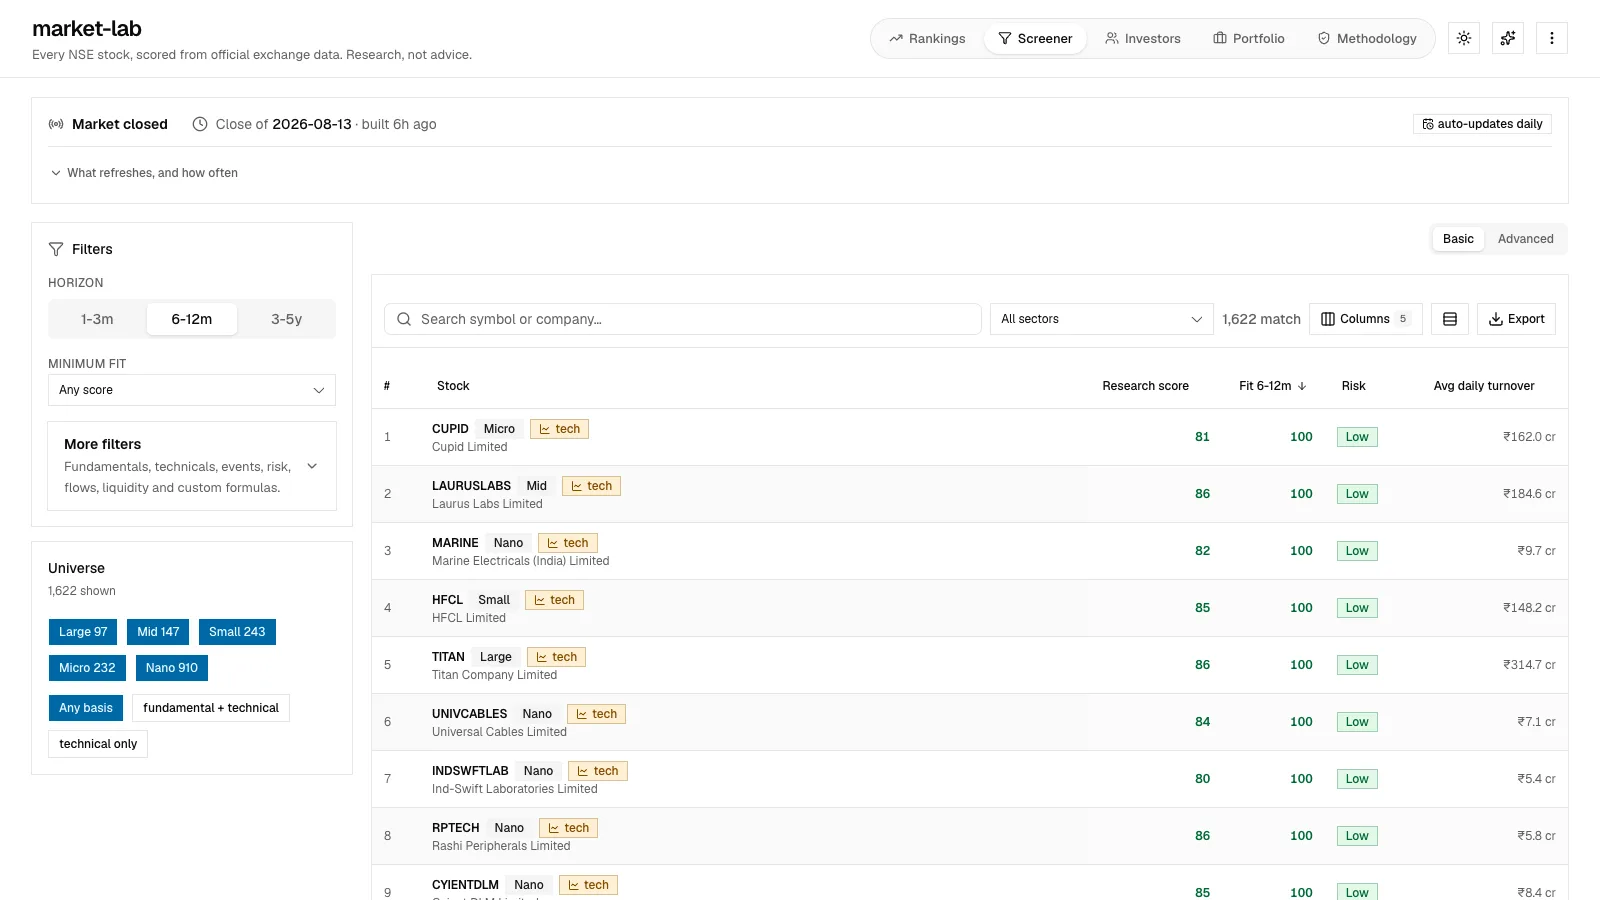
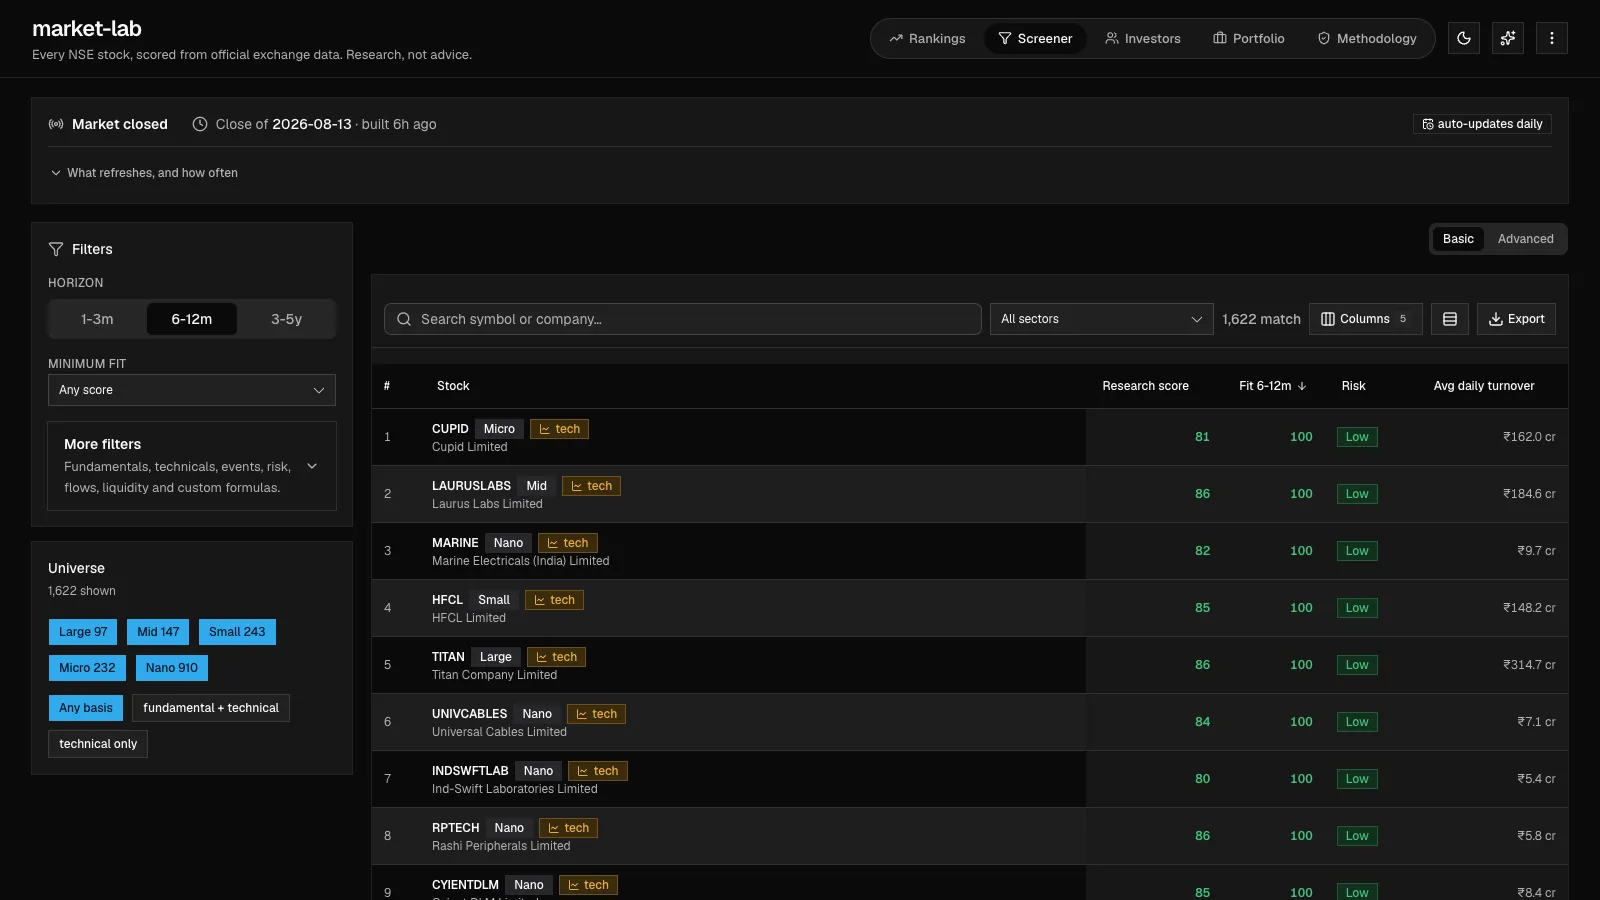
Each signal on the row, why it exists, and how it appears.
| Signal | Why it exists | How it appears |
|---|---|---|
| Opportunity score | Gives research a starting order | Big enough to scan, never alone |
| Risk band | Stops a high score from feeling good across the board | A chip next to the stock name, not buried at the end |
| Liquidity and order impact | Shows whether a real position can get in without moving the price too much | Shown as practical rupee-order context |
| Argument against | Forces the product to say why the score might mislead | Written next to the positive thesis in plain language |
See every screen, failure state, and accessibility check
Every screen keeps the same posture.
Investors. Which investor, horizon, and risk appetite the signal fits.
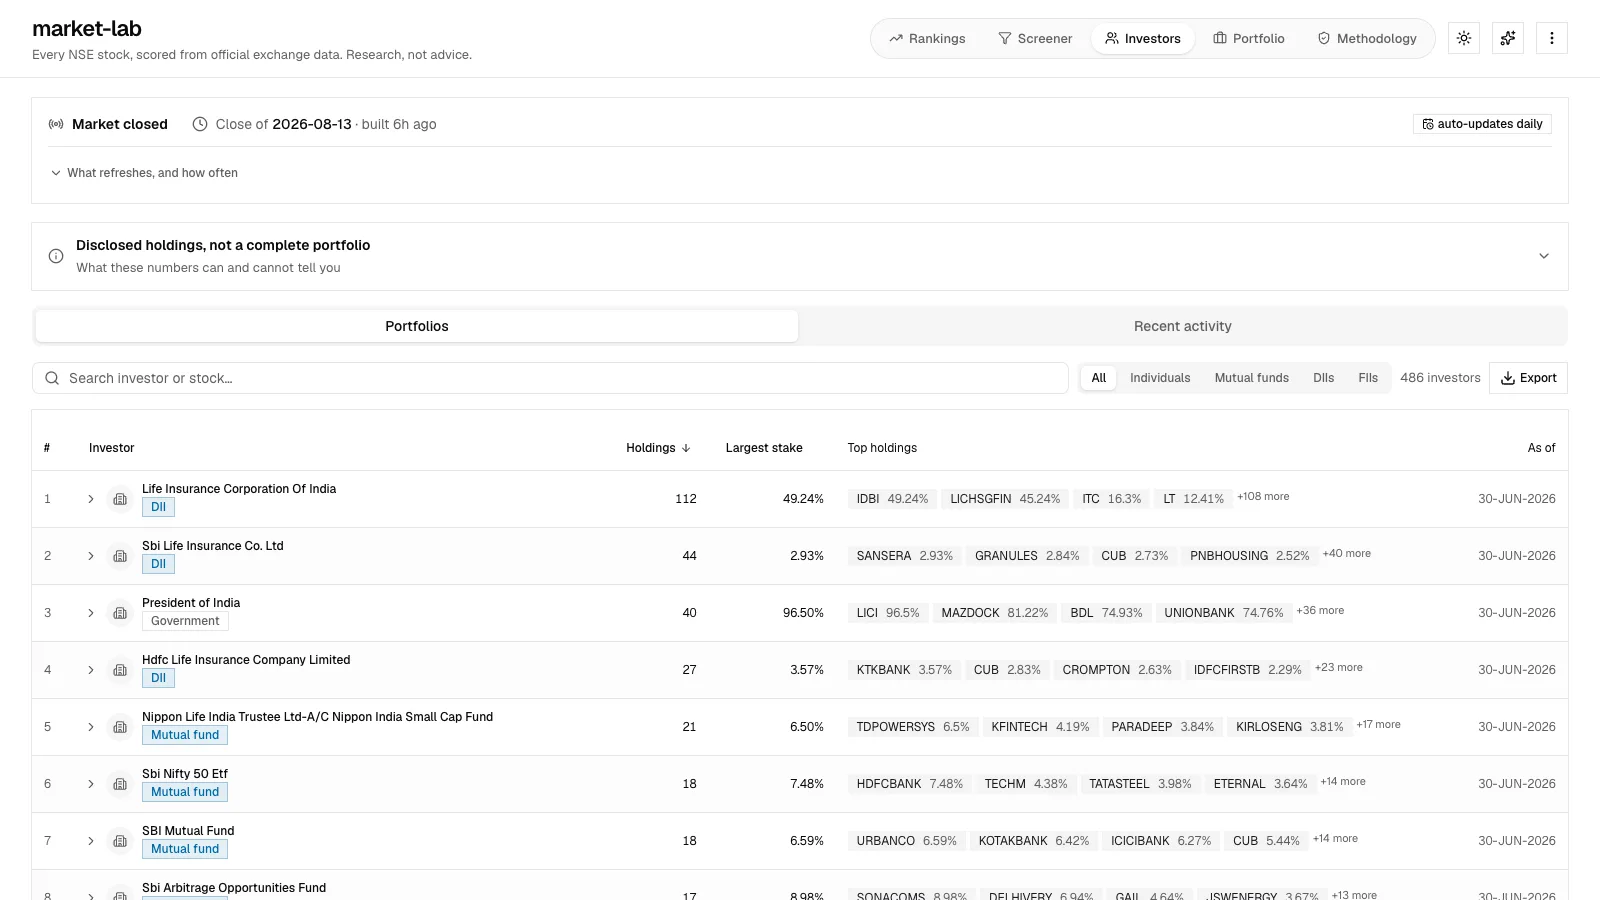
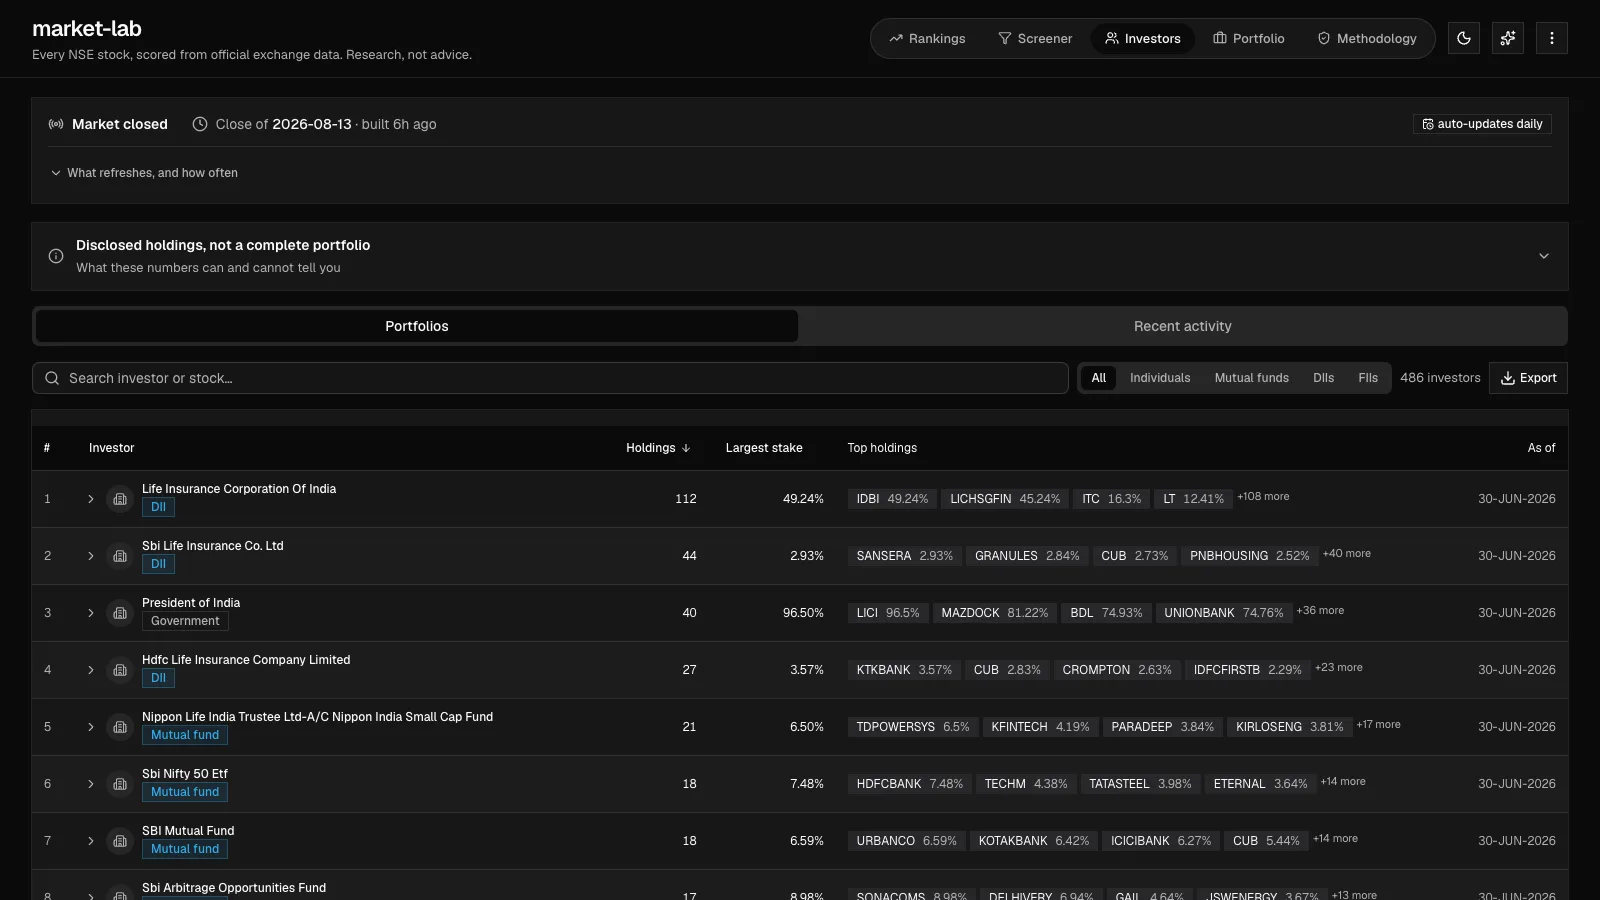
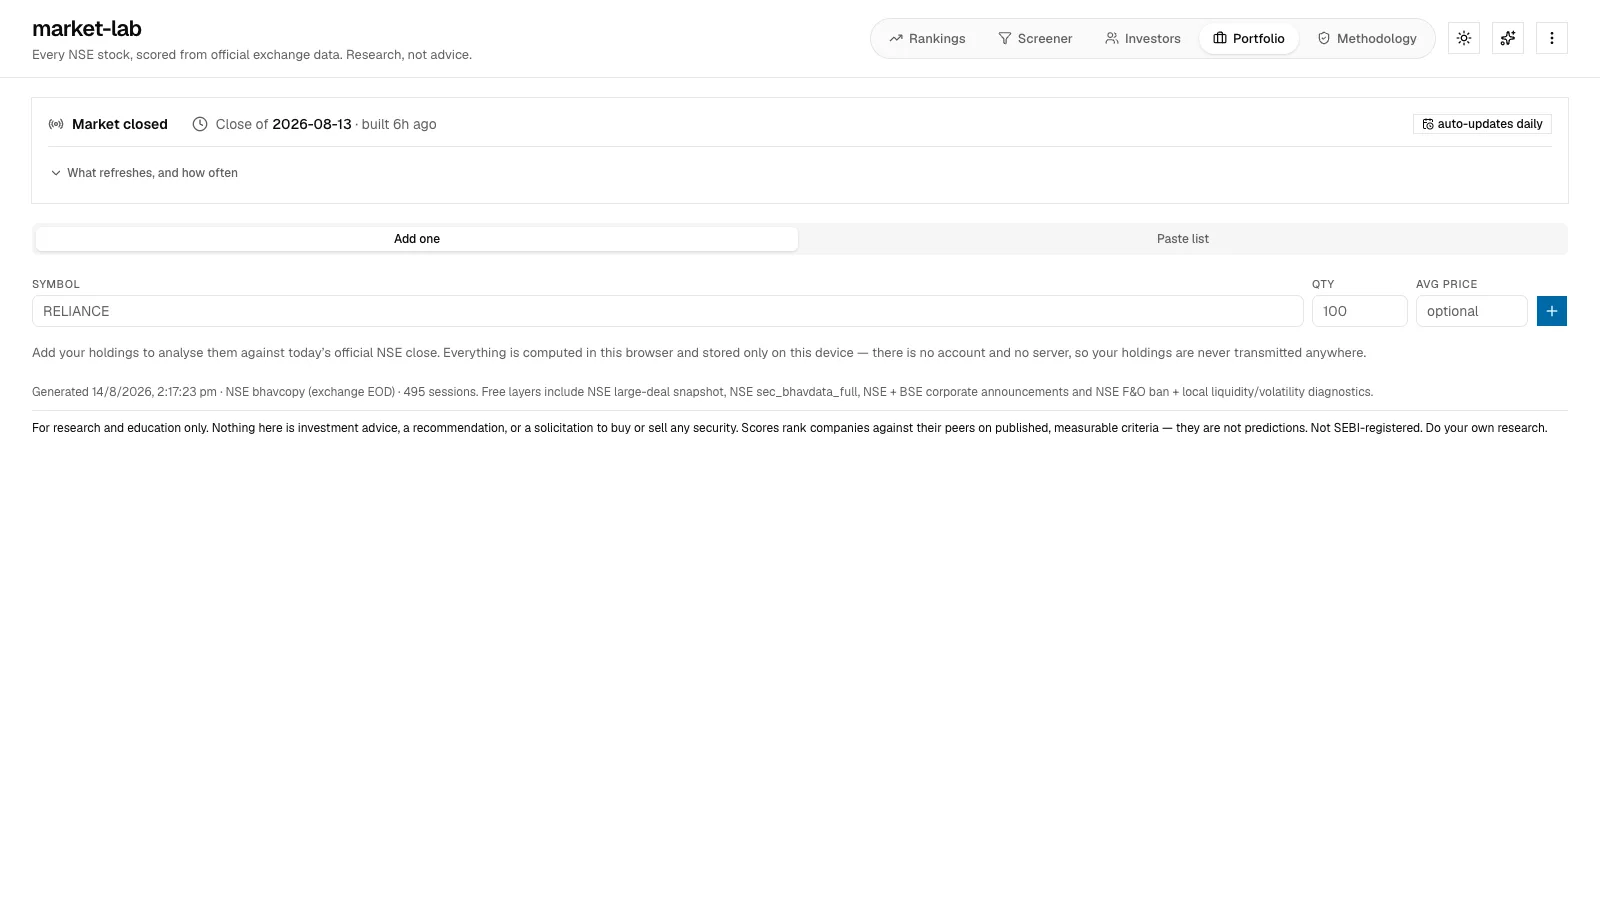
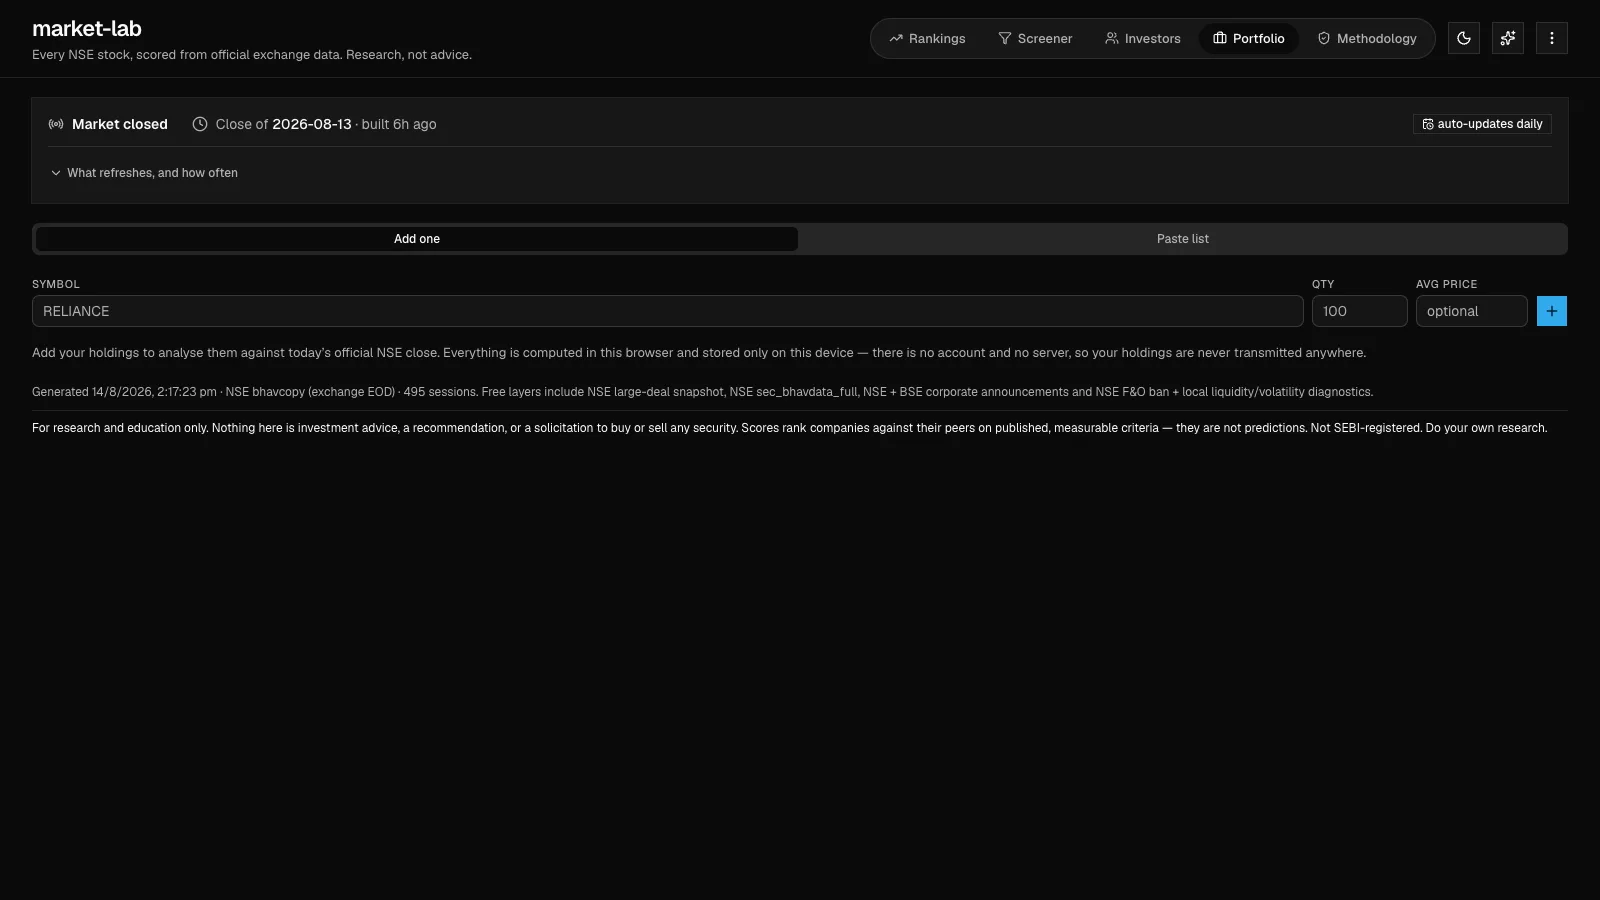
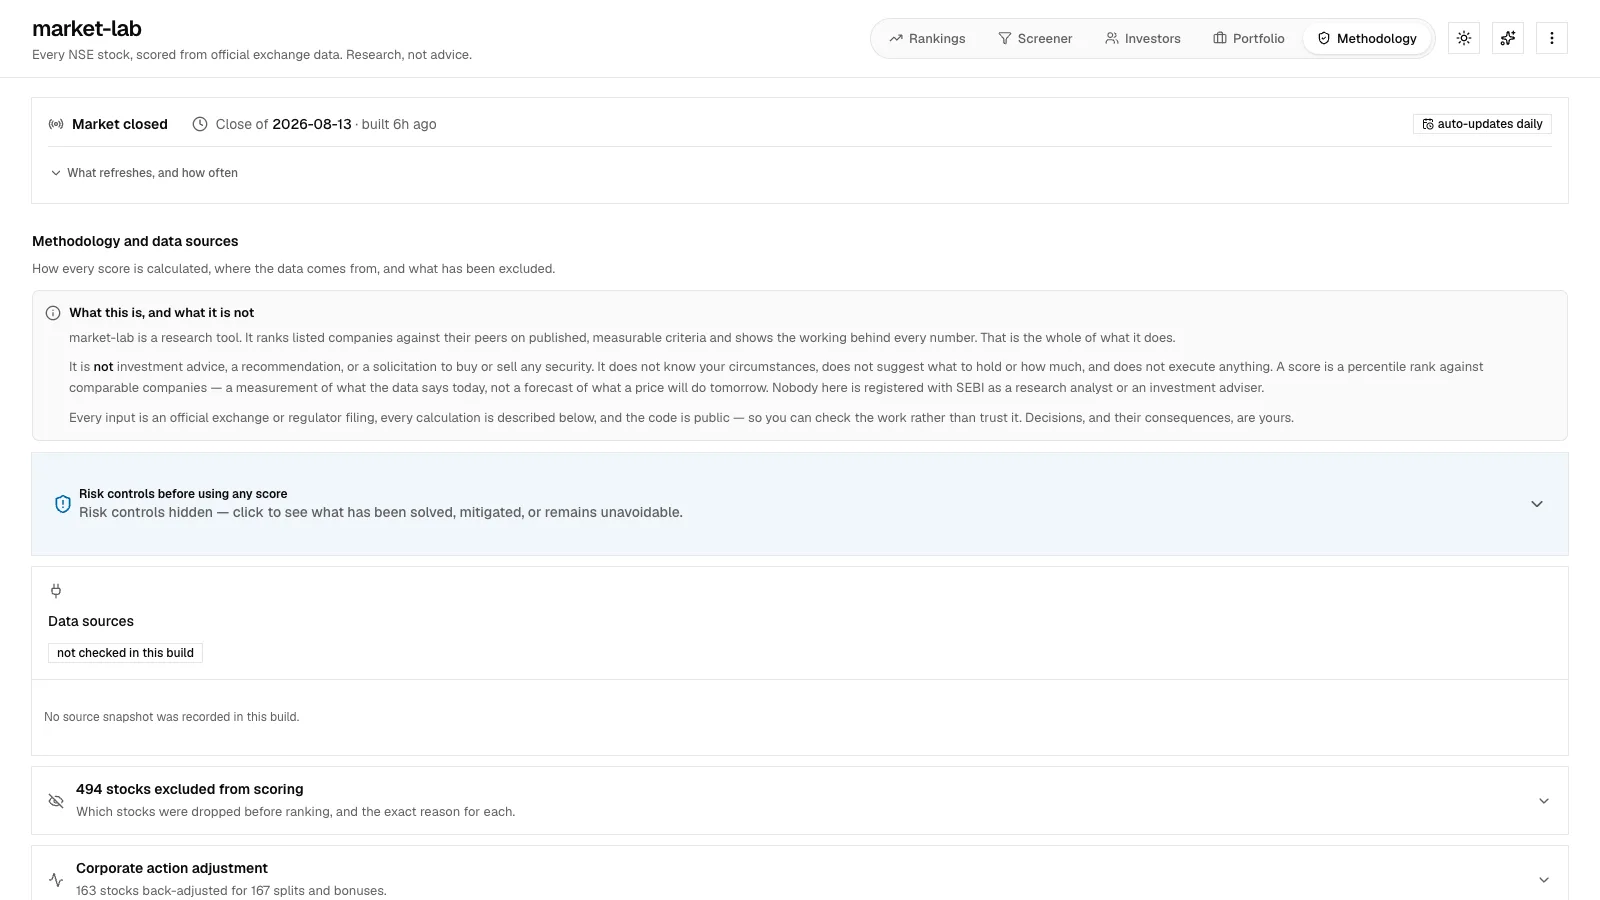
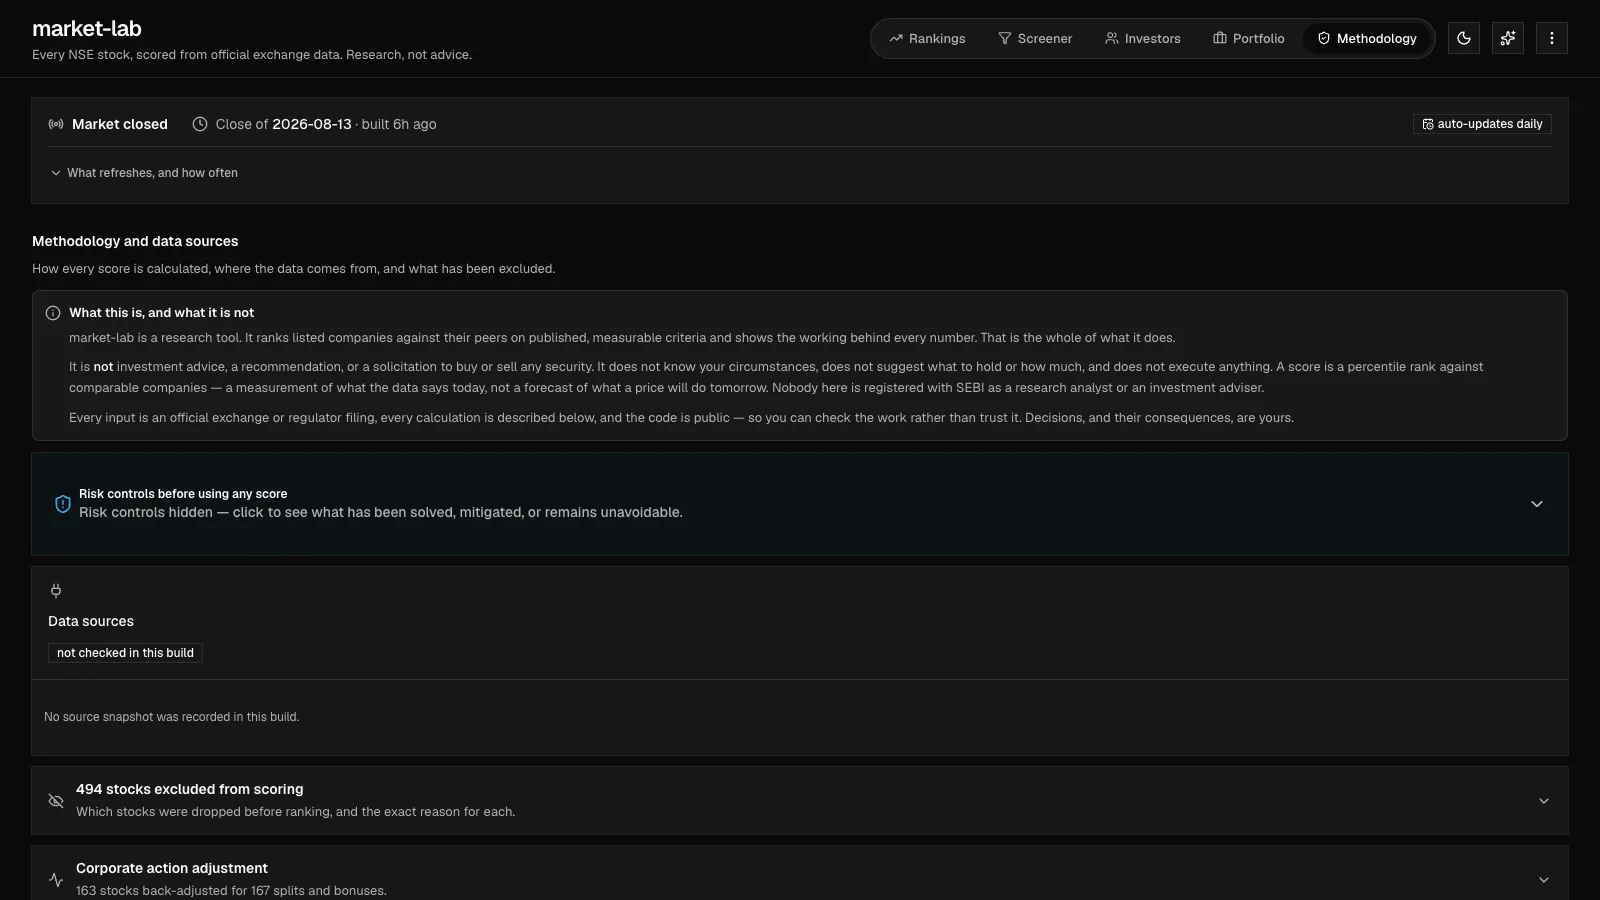
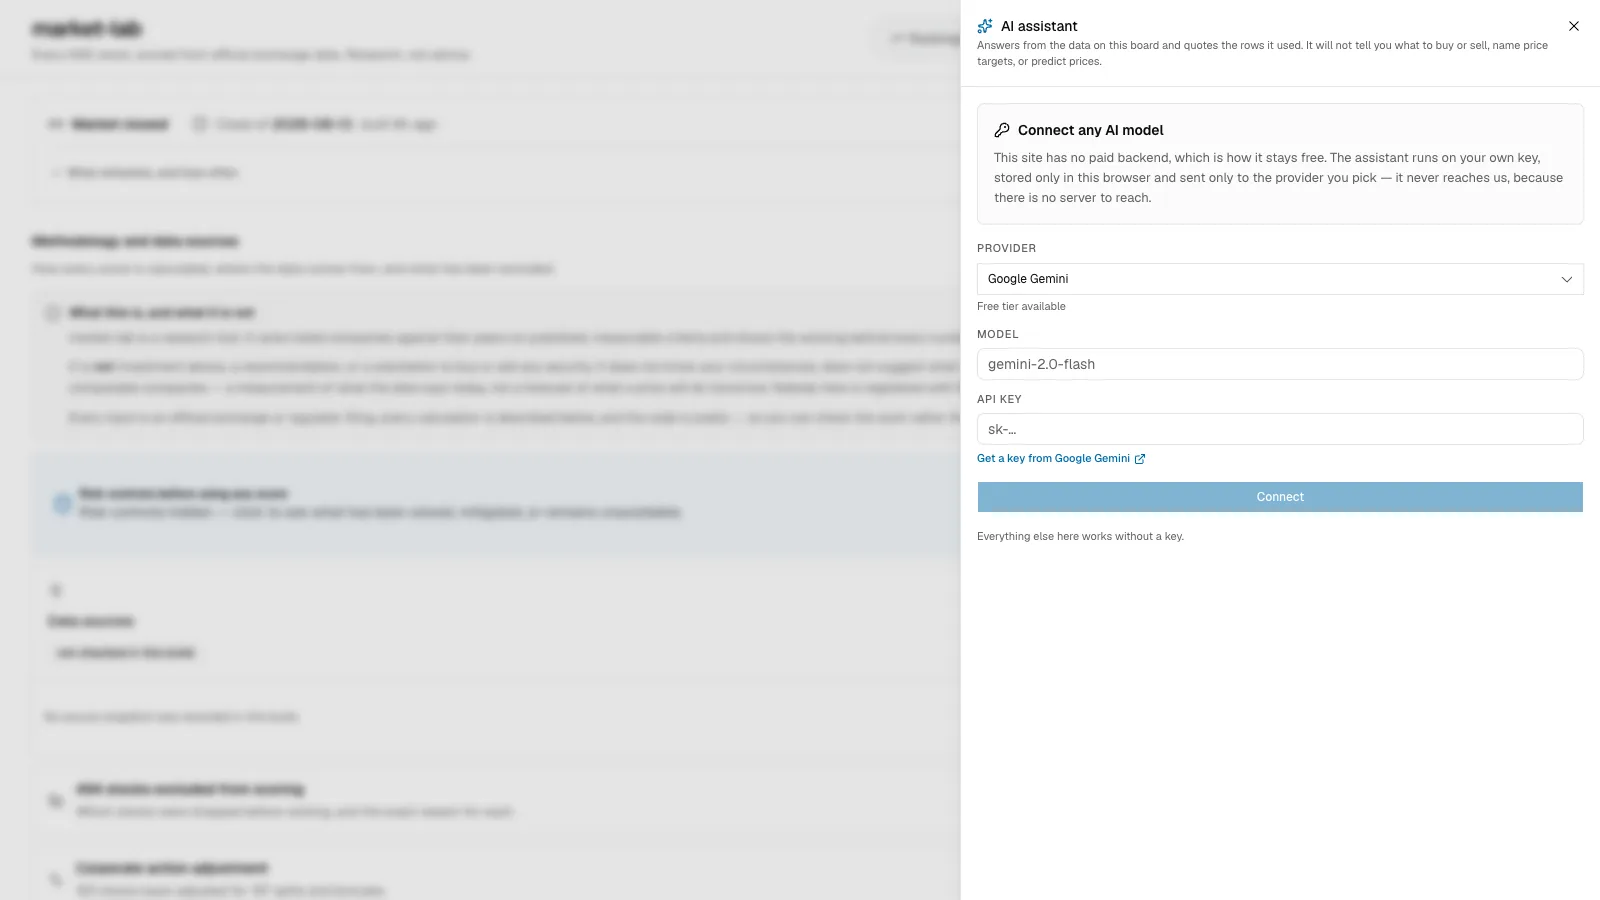
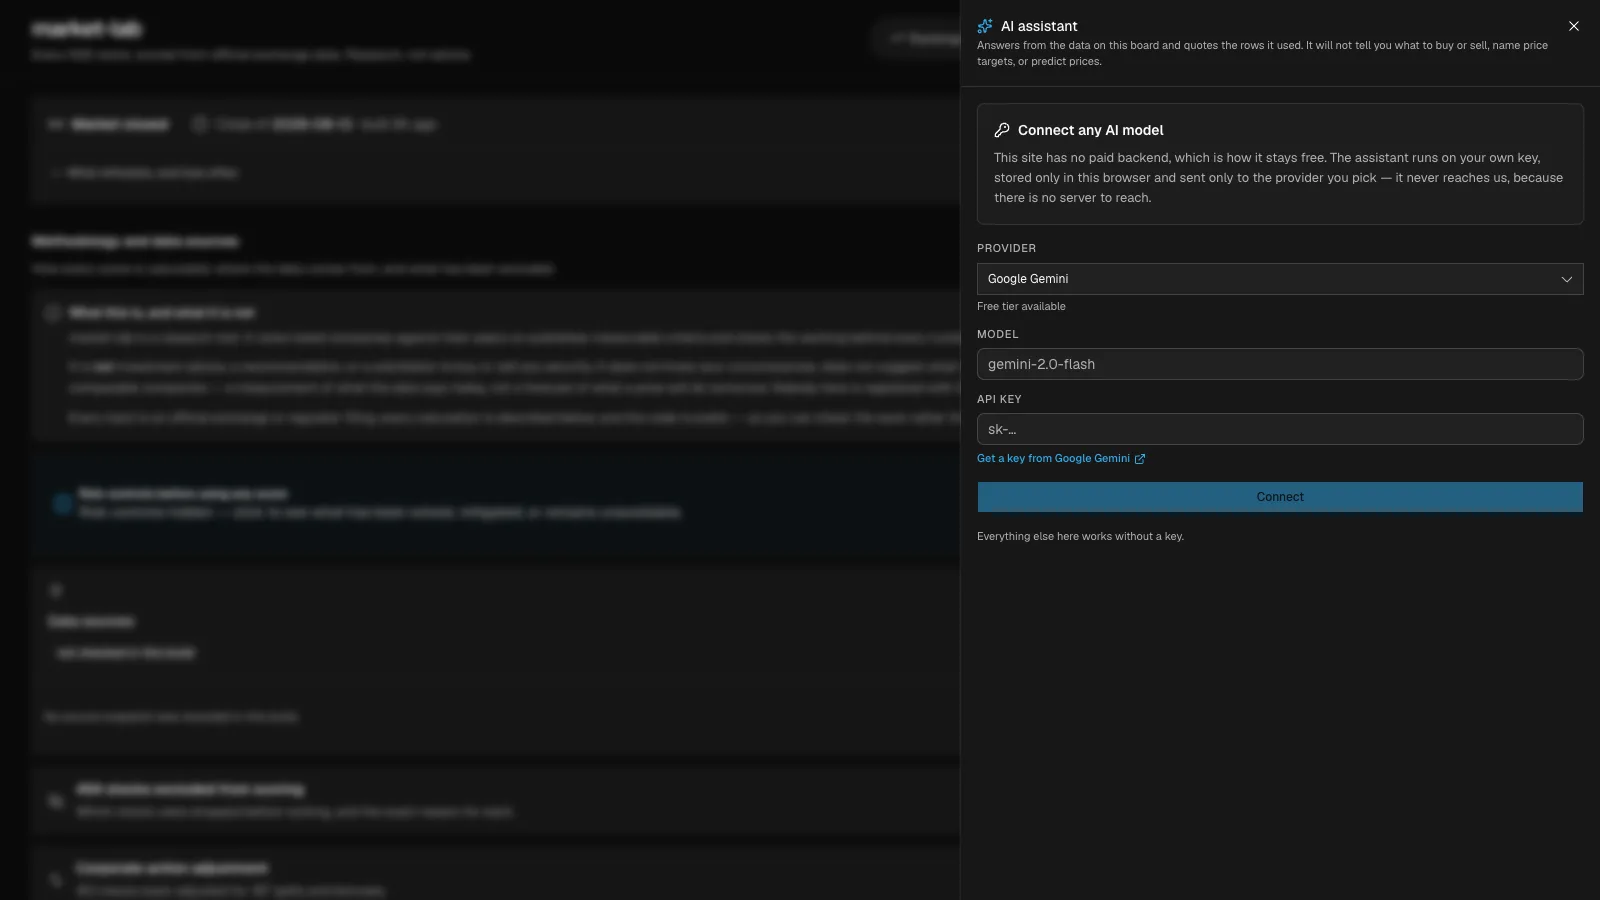
Missing data never looks like weak data.
Reliability lives in the shared data layer: malformed numbers become unavailable, duplicate or damaged rows get counted, and a score is suppressed when its risk, liquidity, or horizon context can’t support it.
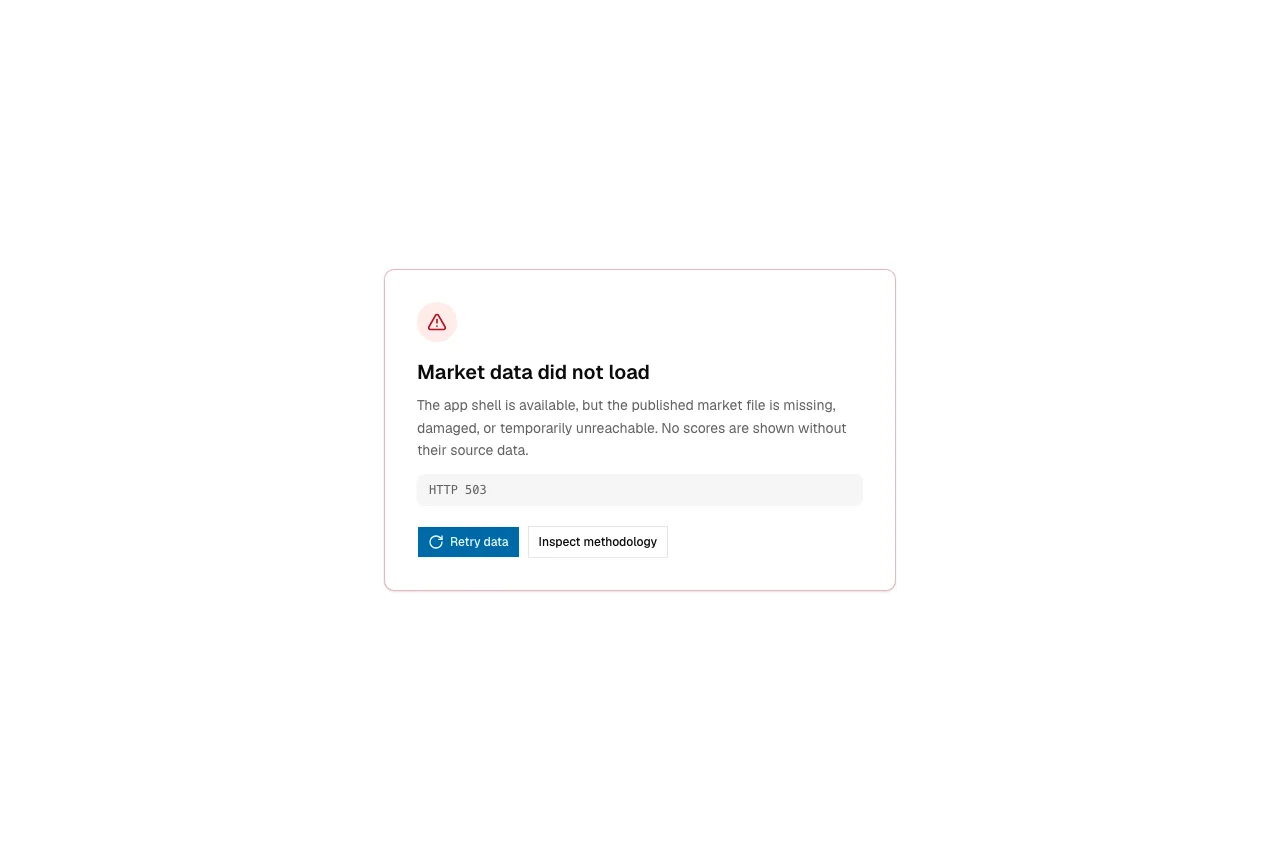
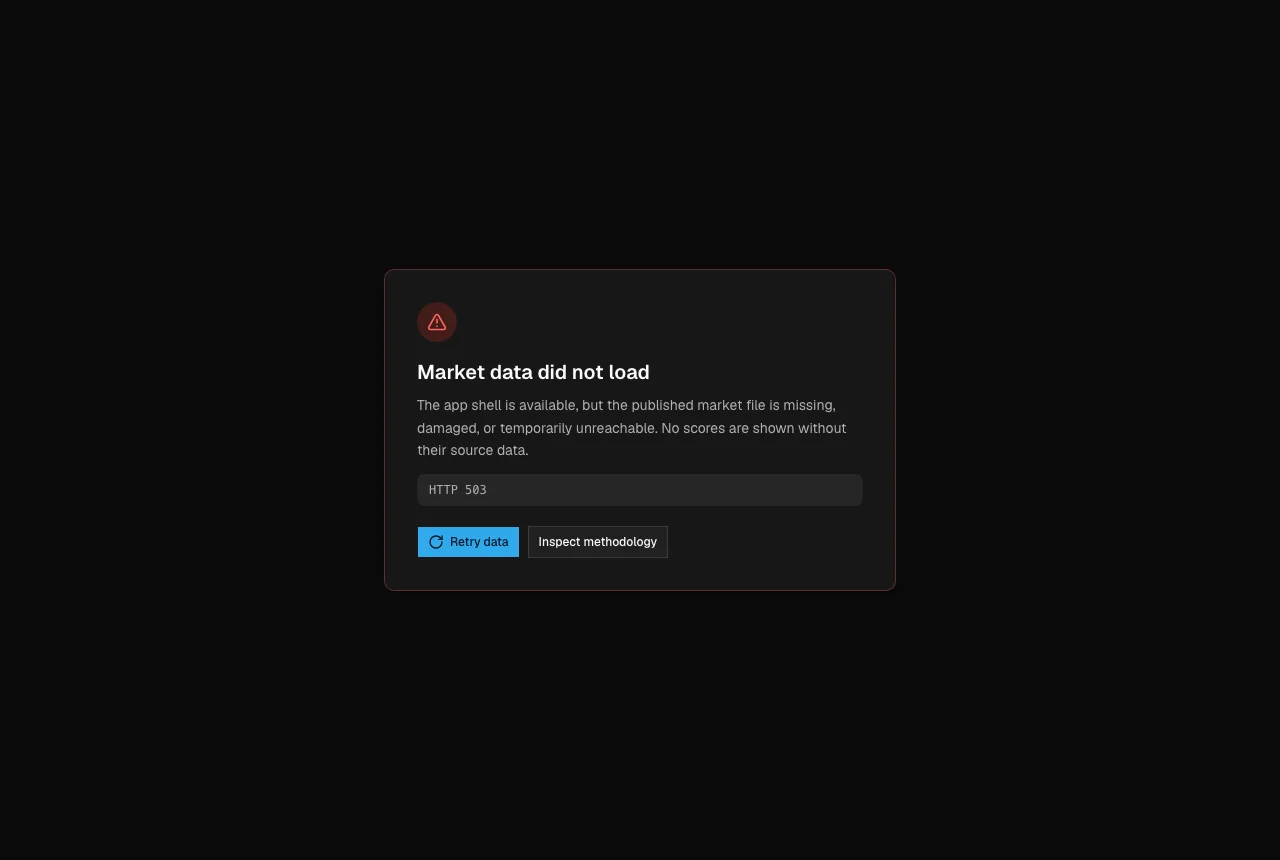
Each failure class, the unsafe default, and the designed response.
| Failure class | Unsafe behavior | Designed response |
|---|---|---|
| Initial data failure | Render an empty board or fabricate zero-like values | Withhold scores, show the failure reason, and offer retry plus methodology |
| Background refresh failure | Replace useful context with a generic error | Keep the last-known screen, mark it stale, and let the user retry |
| Malformed or partial rows | Let missing risk or liquidity look neutral | Mark fields unavailable, count rejected rows, and suppress unsupported rankings |
| Restrictive filters | Treat zero results like a system outage | Name the active constraint and give a direct way to clear or widen filters |
| Invalid portfolio or assistant input | Accept a success-shaped answer | Attach the error to the field or request and keep the user’s work recoverable |
Accessibility gated the release.
The sweep covered every primary view, factsheets, assistant setup, both themes, and loading, empty, degraded, and error states.
Each user need, the evidence for it, and how I checked it.
| User need | Implementation evidence | How I checked it |
|---|---|---|
| Understand status without color | Risk and quality use text, icons, and semantic labels as well as color | Light and dark contrast checks plus non-color state inspection |
| Operate the board without a pointer | Rows, filters, disclosures, factsheets, and assistant controls have keyboard semantics | Tab order, focus visibility, Enter and Space activation, and focus-return tests |
| Hear updates and errors | Loading, result counts, assistant responses, and failures use the right status or alert behavior | Automated role and name checks plus inspection of the critical live regions |
| Zoom or use a narrow viewport | Cards reflow without two-way page scrolling and primary controls keep usable targets | 320, 390, and 430 pixel viewports plus 200%-equivalent reflow |
What this proves, and what it doesn’t.
I designed and directed this alone, with Claude Code writing the code. It shows end-to-end ownership, not team leadership, and the rankings say nothing about investment returns. Judge it on research quality: whether you notice the counter-argument, and whether confidence drops when the evidence is incomplete.
What I’d build next.
Next, I’d add a change log for why a score moved after each trading session, the raw fields behind every final judgment, and structured screen-reader and browser testing.
market-lab’s quality lives in the seam between the model and the interface: help people research faster, and never let speed turn into false confidence.