Speed is not really a property of your software. It is a property of the person using it, and it was measured before most of us were born. Robert Miller published the limits in 1968. IBM put a price on them in 1982. Nothing since has changed the numbers, because the numbers describe a nervous system, not a network.
The three numbers
- 100 milliseconds. Below this, the screen feels like it reacted to you. Cause and effect fuse, like a light switch: you flick it, the light is on. The interface feels like part of your hand.
- 1 second. You notice the delay, but your train of thought survives it. It is like a tap that takes a second to run warm. You do not strictly need feedback here, but you feel the gap.
- 10 seconds. This is the limit of attention. Past it, the user's mind wanders off to something else. You have lost them, even if the task finishes later.
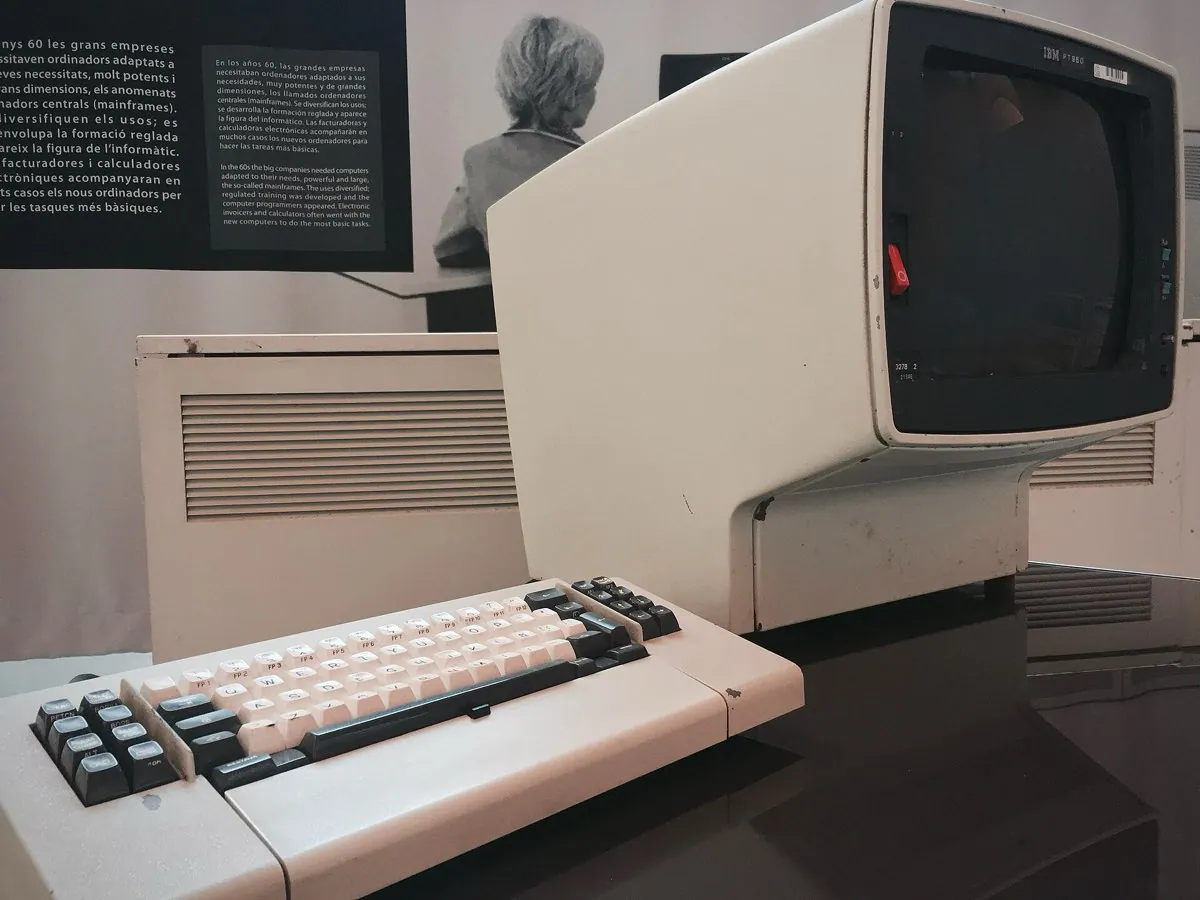
Then in 1982, Walter Doherty and Ahrvind Thadani at IBM found something sharper. They timed expert users against how fast the system replied. When the reply dropped below about 400 milliseconds, people did not just work a bit faster. They jumped to a new gear. They stopped waiting on the machine, and the machine started waiting on them. They called it the Doherty Threshold, and it is still the most valuable number in interface design.
Productivity soars when a computer and its users interact at a pace that ensures neither has to wait on the other.
- Feels instant100 mscause and effect fuse
- Doherty flow400 msthe machine waits on you
- Thought holds1 sdelay noticed, focus survives
- Attention gone10 sthe user context switches away
Why INP replaced the metric you learned
Google retired First Input Delay in March 2024 and replaced it with Interaction to Next Paint, or INP. That is a fancy name for a simple idea: how long from your tap to the screen actually changing. The old metric only timed how long the browser took to start handling your tap. INP times the whole trip, tap to visible change, for every action in the session, and reports one of the worst.
So the industry standard moved from timing the machine getting ready to timing the user's whole experience of one action. Google's bar for good is 200 milliseconds. That is Doherty's number with a bit of browser tax added on.
| INP rating | Threshold | What the user feels |
|---|---|---|
| Good | at or under 200 ms | Interactions keep pace with intent |
| Needs improvement | 200 to 500 ms | A noticeable hitch on some taps |
| Poor | over 500 ms | The interface feels like it stalled |
You cannot beat physics, so beat the feeling
A round trip to a server on another continent costs you 150 milliseconds before your code runs one line. If the tap has to be confirmed by that server first, you have already lost the Doherty Threshold. So you stop confirming, and start predicting.
Optimistic UI just means: show the result at once, then check with the server behind the scenes. You apply the change on screen the instant the user acts. You send the request in the background. You fix things up if the real answer disagrees. It feels free because, to the user, it was. Now all the design work moves to the two percent of cases where the server says no.
async function toggleFavourite(id: string) {
  const previous = store.get(id)
  store.set(id, { ...previous, favourite: !previous.favourite }) // 0 ms

  try {
    await api.favourite(id)
  } catch {
    store.set(id, previous)          // revert, but do not startle
    notify({
      tone: "quiet",                 // never a red modal
      text: "Couldn't save that. Retrying.",
      action: { label: "Undo", run: () => store.set(id, previous) },
    })
  }
}Where the money is
The money case has been public for twenty years. Amazon reported that every 100 milliseconds of extra delay cost about one percent of sales. Google found that adding half a second to a search page cut traffic by around twenty percent. These are old numbers from a slower web, and people keep finding the same thing since. Deloitte's 2020 study with Google found that a 0.1 second speedup lifted retail sales by over eight percent.
What I take from this is simple. Latency is one of the very few design choices with a revenue line you can point straight at. That makes it the easiest craft argument you will ever win in a room full of executives.
Perceived time runs on a different clock
The time a person feels is not the time your stopwatch measures. David Maister set out why in 1985, in a paper on the psychology of waiting lines. Occupied time feels shorter than empty time. Uncertain waits feel longer than known ones. And unexplained waits feel longest of all. Every good loading state is really an answer to one of those three.
A bare spinner fails all three at once. It gives you nothing to do, no idea how long, and no idea why. That is the worst combination there is, which is why a spinner running for more than a second or two feels so much longer than the clock says it is. The fix is not always a faster server. It is often a wait that occupies you, sets an expectation, and explains itself.
Match the tool to the length of the wait
Three tools cover almost every case, and each one only works inside its own band of time. Reach past the band and the tool starts to hurt.
Under a second, when you can guess the outcome, use an optimistic update. Show the result the instant the person acts and reconcile with the server behind the scenes. The wait is filled with the actual result, so perceived time is zero. A like, a toggle, a rename: predictable, so safe to show before the server confirms.
Between roughly a tenth of a second and a second, use a skeleton. That is the grey placeholder shaped like the content that is coming. It occupies the wait and promises a layout, so the real content snapping in reads as completion rather than surprise. Skeletons only earn their place in that middle band. Under 100 milliseconds they flash and look broken. Past a few seconds they start to feel like a lie, because nothing about them is moving forward.
Past a second, when you know roughly how much work is left, use a progress indicator that genuinely moves. Motion is occupation, and advancing motion is a sense of progress. A bar that fills answers both hard questions at once: how long, and are we actually getting there.
| Wait length | Right tool | Why it fits |
|---|---|---|
| Under ~1 s, outcome predictable | Optimistic update | Fills the wait with the real result |
| ~0.1 s to ~1 s | Skeleton of the layout | Occupies the wait, promises a shape |
| Over ~1 s, work is knowable | Moving progress bar | Shows how long and that it advances |
| Over ~10 s, or unknown | Narrate and let them leave | Turns one long silence into steps |
A progress bar may lie, and that can be right
A progress bar that bends the truth is sometimes better than an honest spinner. Chris Harrison and colleagues at Carnegie Mellon tested this directly. They found that the way a bar animates changes how long the same wait feels, even when the real duration is identical to the millisecond. Bars that speed up toward the end, and bars that never pause or slip backward, are reliably judged as faster.
The practical reading is uncomfortable but clear. A bar that stalls at 99 percent feels broken even when it is telling you the exact truth. A bar that moves smoothly and steadily, rounding off the ragged real progress underneath, leaves people happier than a perfectly accurate one that jerks and freezes. A steady sense of motion is worth more than an honest percentage. This is one of the few places in design where the honest readout is the worse choice.
When you truly cannot make it faster
Sometimes the work is simply slow and no amount of engineering will fix it: a huge export, a cold model spinning up, a third party you do not control. The move then is to stop hiding the wait and start narrating it. Say what is happening and roughly how far along it is.
Break one long unknown wait into a run of short known ones, labelled as they pass: uploading, then processing, then almost done. Several short explained steps feel shorter than one long silent gap, because each step resets the sense of progress. Show partial results the instant you have them, first line first, so a ten second wait becomes one second plus nine seconds of reading. And where you can, let people walk away: start the job, free them to do something else, and tell them when it is done. A wait you can leave barely counts as a wait at all.
Emil Kowalski and Rauno Freiberg both make the same point from the craft side. The interactions that feel fastest are rarely the ones that finish first. They are the ones that respond first. Response is the part you always control, even on a slow network you do not.