Charts That Tell the Truth
Data visualisation as a working tool, not a magazine graphic
A chart in a product interface is a tool, not a picture. Someone is using it to make a decision in the next ten seconds, not admiring it in a magazine. There is 40 years of research on how accurately human eyes read different shapes, the ranking is clear, and most product charts still pick the shapes that read worst. This is a piece about doing the opposite on purpose.
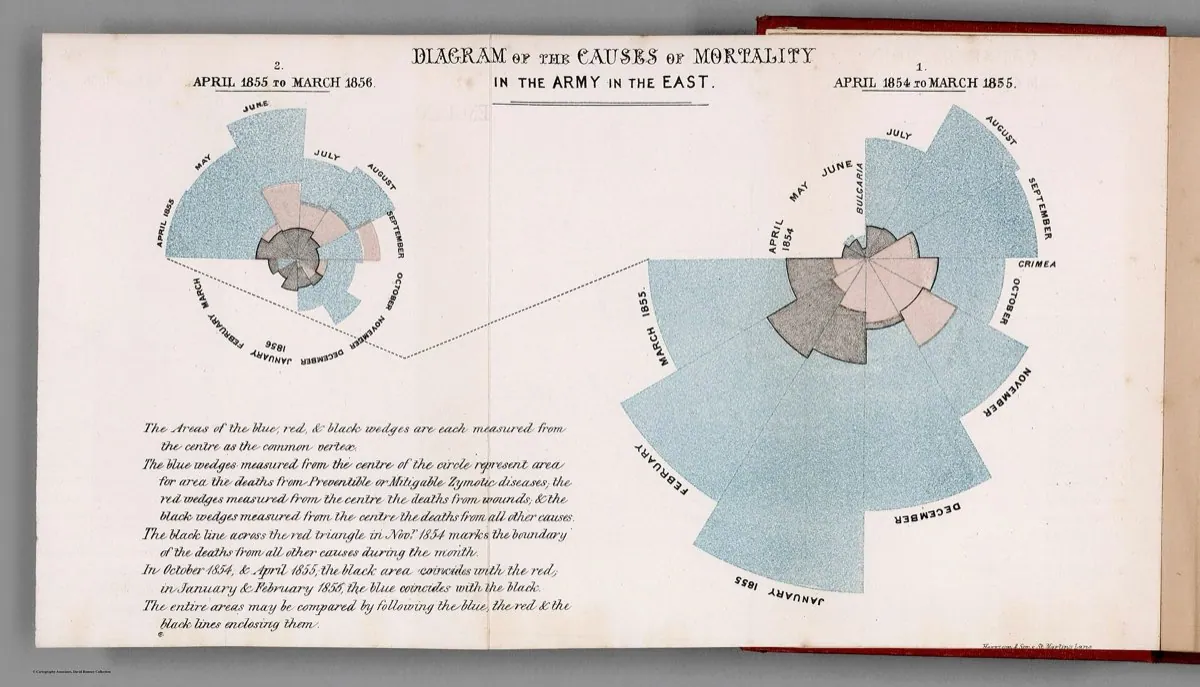
Your eyes have a ranking, and it is not a matter of taste
In 1984 William Cleveland and Robert McGill ran a set of experiments that should be taped to every dashboard team's wall. They showed people the same numbers drawn as different shapes, then measured how accurately people could read the values back. The result was a ranking of visual encodings, ordered from most accurate to least. Position on a common scale won. Length came next. Then angle and slope. Then area. Then colour and shading came last, by a wide margin.
Think of it like reading a ruler versus judging a handful of coins. Two dots against the same axis are a ruler: you can say which is higher and by roughly how much. Two coloured squares are the coins: you can tell they differ, but ask by how much and everyone guesses differently. The ranking is not an opinion. It is a measured property of the visual system, and it holds whether the reader is a data scientist or a shopper.
The ranking has held up for decades of follow-up work, which is rare in this field. Later researchers re-ran versions of it, including a large crowdsourced replication by the team who went on to build D3 and Vega, and the ordering held. That is worth pausing on. A result from 1984, confirmed by the engineers who wrote the modern charting tools, is baked into the defaults those tools ship. Picture an election night read as bars versus as a pie. On the bars you rank the parties in a second. On the pie you argue about which slice came second.
Here is why this matters on a Tuesday. A bar chart encodes value as length against a shared baseline, which is near the top of the ranking. A pie chart encodes value as angle and area, which are further down. So when you swap a pie for a bar, you are not changing the style. You are moving the reader up the accuracy ladder. The same numbers become easier to read, and no one has to try harder.
Pies, donuts, and axes that lie by accident
A pie chart asks you to compare wedges by angle. Two slices that are close in size look the same, and a donut is worse because it removes the centre, where the angle was easiest to judge. There is one job a pie does honestly: showing that one part is about half, or about a quarter, of a whole. Past two or three slices, a bar chart wins on every count. Datawrapper, whose team writes some of the most careful practical guidance in this field, lands in the same place after years of reader testing.
- Pie or donut with eight slices
- A legend off to the side
- A rainbow of unrelated colours
- Values compared by angle and area
- Reader squints, then gives up on the small ones
- Sorted horizontal bars
- Labels sit on the bars, no legend
- One colour, with the point highlighted
- Values compared by length on a shared axis
- Reader ranks all eight at a glance
A donut makes it worse by removing the centre, and dashboards love donuts because the hole leaves room for a big number in the middle. That number is the tell. If you have to print the value in the middle because the wedge cannot convey it, the wedge was never doing its job. On a phone it gets harder still, when the legend and its slices do not fit on screen together and the reader scrolls between a colour key and the shapes it explains, holding the mapping in memory. That is the coins problem stacked on top of a memory problem.
Now the harder case: the truncated axis. A bar chart must start at zero, because the bar's length is the value, and cutting the baseline makes a 2 percent difference look like a 200 percent one. That is the classic lie. But a line chart tracking a stock price or a body temperature does not have to start at zero, because a line encodes change, not magnitude, and forcing a zero baseline can flatten the very signal the reader came for. So the rule is not one rule. Bars start at zero. Lines start where the story is, and you label the axis honestly so no one is fooled.
The dashboard that shows everything and means nothing
Most product dashboards are a wall of tiles. Twelve charts, all the same size, all shouting at once. The problem is not density. The problem is that nothing is ranked, so the eye has no idea where to land. A good newspaper front page has one lead story and a hierarchy under it. A dashboard needs the same. One number that matters most, sized and placed so you see it first, and the supporting charts arranged around it.
The technique that rescues most crowded dashboards is small multiples: instead of one busy chart with ten overlapping lines, draw ten tiny charts on a shared scale, side by side. Your eye compares them the way it compares a row of houses on a street. Pair that with direct labelling. Put the series name at the end of its line, where the reader is already looking, and delete the legend that forced them to bounce between a colour key and the data. A legend is a lookup table your reader has to run in their head.
The other rescue is to let the dashboard say where to look, instead of asking a person to eyeball twelve charts for anomalies. Decide the one metric that would make someone act, make it the largest thing on the page, and give the rest a supporting role. A single red flag on the chart that breached its target does more than twelve perfectly drawn trends competing for attention. Spotting the odd one out is exactly the job a computer does better than a tired human at 6pm, so hand it over. A tool that never says look here is making you do the scanning.
Overview first, zoom and filter, then details on demand.
Shneiderman's mantra is the whole brief for an interactive chart. It is also where I part company with the strictest reading of Edward Tufte. Tufte's data-ink ratio says erase every mark that is not data: gridlines, borders, backgrounds, redundant labels. In print, on a static page a reader will study for a minute, he is right and it is beautiful. In a live product it goes too far. A faint gridline is not clutter, it is the ruler that lets someone read a value. A hover target needs to be big enough to hit. A redundant label saves a trip to the legend. Tufte optimised for the printed page. Product charts also carry affordances, and orientation is not decoration.
Colour is a decision, not a default
Colour sits at the bottom of the accuracy ranking, so it should carry meaning you cannot get from position, never the primary value. When you do use it, the type of data decides the type of scale, and getting this wrong is one of the most common product-chart mistakes I see.
| Data shape | Scale to use | Example | Common mistake |
|---|---|---|---|
| Ordered, one direction | Sequential, light to dark | Signups per region | A rainbow that hides the order |
| Ordered around a middle | Diverging, two hues from a neutral centre | Budget over or under target | A sequential scale that buries the zero point |
| Unordered categories | Qualitative, distinct hues | Product lines | A gradient that implies a ranking that is not there |
Then there is the rainbow. The old jet colormap, red through yellow through green to blue, looks scientific and lies constantly. It is not perceptually uniform, which means equal steps in the data become unequal steps in what you see. It invents sharp bands where the data is smooth, and it collapses for the roughly one in twelve men with red-green colour blindness. This is why Matplotlib changed its default to viridis, a scale built to be perceptually uniform and colour-blind safe. If your heatmap looks like a weather map from the 1990s, that is the bug, not the style.
Categorical palettes have a hard ceiling too. Past about seven or eight distinct hues, people cannot reliably tell one from another, and colour-blind readers hit that wall much sooner. So if your legend carries twelve colours, the colours have stopped being an encoding and become decoration that happens to differ. Encode the series that matter with position or a direct label, and let colour carry only a coarse grouping. Where colour must mean something, back it with a second channel, a shape or a label, so the chart still works in greyscale and for anyone who cannot separate red from green.
Show the doubt, and make the chart readable without eyes
Almost every product chart states its numbers as if they were exact. A forecast line lands on a single pixel. A conversion rate reads 4.2 percent with no hint that it is 4.2 give or take a point. This is not honesty, it is false precision, and it makes people trust the wrong decimal. The fix is old and boring: error bars, a shaded confidence band, a range instead of a point. It feels less tidy. It is more true, and a chart that hides its own uncertainty is doing PR, not analysis.
The last failure is the one that gets a team a legal letter, not just a bad decision. A chart is an image, and to a blind user an unlabelled image is nothing. The W3C guidance on complex images is direct: a chart needs a short text alternative that states its purpose, and a longer equivalent nearby, usually the data table it was drawn from. Add that table and you help everyone. Sighted users get exact values on hover, keyboard users get a focus order, and search engines and screenshots get real content instead of a blank rectangle.
<figure role="group" aria-labelledby="cap">
  <figcaption id="cap">Weekly active users, last 4 weeks</figcaption>

  <!-- The chart is drawn on top of this, not instead of it -->
  <table>
    <caption class="sr-only">Weekly active users by week</caption>
    <thead><tr><th>Week</th><th>Users</th></tr></thead>
    <tbody>
      <tr><td>Week 1</td><td>12,430</td></tr>
      <tr><td>Week 2</td><td>13,120</td></tr>
      <tr><td>Week 3</td><td>12,980</td></tr>
      <tr><td>Week 4</td><td>14,510</td></tr>
    </tbody>
  </table>
</figure>That table underneath is not a fallback for a tiny minority. It is the most durable version of your chart. Pixels get resized, screenshotted, and re-themed until the labels no longer fit, but the numbers in a table survive all of it. Build the chart on top of real markup and you get accessibility, resilience, and a free data export, all from the same few lines.